The Challenge
Innoviti Payment Solutions needed to make sense of enormous transaction volumes flowing through their payment terminals deployed across thousands of merchant locations in India. Leadership required real-time visibility into transaction performance, terminal health, and merchant analytics — but the raw operational data lived in fragmented MySQL databases with no analytical layer on top.
The Approach
The project was structured around four delivery tracks: a centralised data warehouse, ETL automation, live dashboards, and scheduled report distribution.
- Data Warehouse Architecture: Designed and implemented a PostgreSQL-based data warehouse with a dimensional model — separating terminal, merchant, transaction type, and time dimensions from the core transaction fact table to enable flexible slice-and-dice analysis.
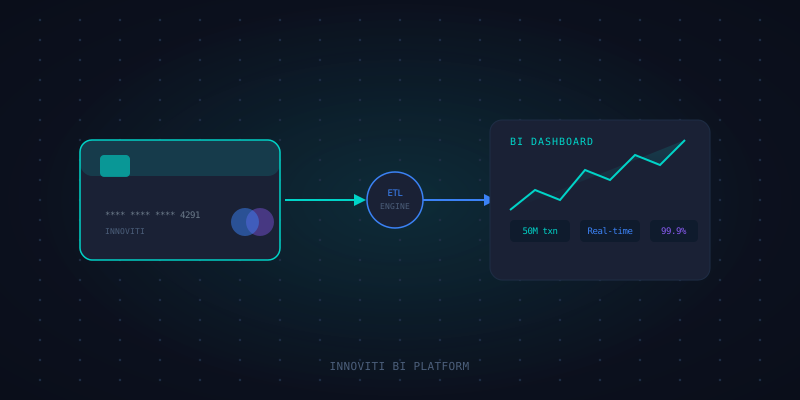
- ETL Pipeline: Built automated Pentaho PDI jobs to pull daily transaction data from MySQL operational databases, apply business transformations (currency normalisation, merchant categorisation, terminal status mapping), and load into the warehouse with full incremental refresh logic.
- Power BI Dashboards: Developed executive and operational dashboards covering transaction volumes, approval rates, terminal uptime, and merchant-level performance. Used DirectQuery for real-time KPIs and Import mode for historical trend analysis.
- Automated Reporting: Scheduled daily and weekly summary reports via Pentaho BI Server, delivering automated PDF/Excel reports to regional operations teams without manual extraction effort.
The Results
Operations teams went from manually pulling and stitching CSV exports to live dashboards refreshing every 15 minutes. The automated reporting saved an estimated 8–10 hours per week of manual analyst work across the reporting team.
50M+
Transactions Processed
6,000+
Merchant Terminals
15 min
Dashboard Refresh Cycle
Key Takeaways
The most valuable design decision was separating the "operational" and "analytical" MySQL schemas early in the project. Trying to report off the live OLTP database caused locking issues and slow queries — once we introduced a dedicated PostgreSQL analytical layer with properly indexed dimension tables, dashboard load times dropped from 30+ seconds to under 3 seconds.