The Challenge
CX teams were working from disconnected data sources: NPS survey results in one spreadsheet, sales funnel data in another, and customer support tickets in a third system. Producing a weekly CX report required 2–3 days of manual data assembly, leaving leadership always looking at last week's picture rather than today's reality.
The business needed a single source of truth for all customer experience signals — one that could support both high-level executive review and granular product-team deep dives, with near-real-time data.
The Approach
- Unified Data Model: Designed a star schema in MySQL with a central customer event fact table (survey responses, funnel steps, purchase events) linked to customer, product, channel, and time dimensions — enabling any CX metric to be sliced by any dimension without re-joining data each time.
- ETL Automation: Built Pentaho PDI jobs to pull survey data from the SurveyMonkey API, funnel data from the analytics platform, and purchase data from the CRM on a nightly schedule — all converging into the central warehouse with deduplication and late-arriving data handling.
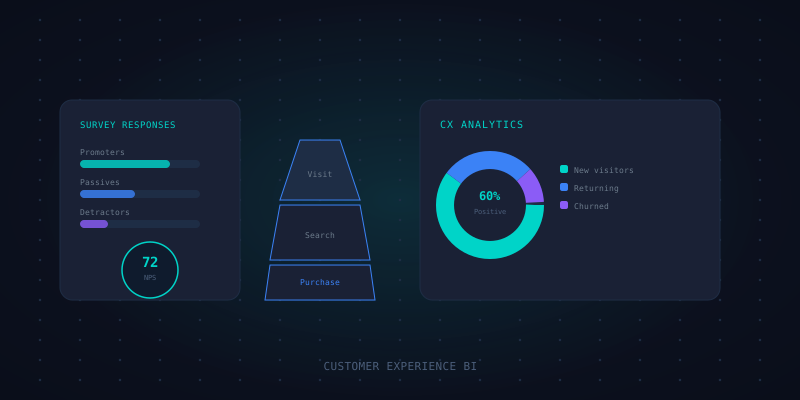
- Tableau Dashboards: Published four Tableau workbooks to Tableau Server — an Executive NPS View, a Funnel Health Dashboard, a Promoter/Detractor Drill-Down, and a Cohort Repeat-Purchase Tracker. Each was built with Tableau Parameters so end-users could self-serve time-range and segment filtering without IT requests.
- Power BI Report: Delivered a parallel Power BI report for a stakeholder group already using Microsoft 365, connecting to the same MySQL warehouse so both BI tools stayed in sync from a single source.
The Results
The weekly manual CX report was eliminated entirely — replaced by a live Tableau dashboard. NPS visibility improved from weekly to daily, enabling the CX team to detect and act on emerging dissatisfaction signals within 48 hours rather than the previous 7–10 day lag.
4
Tableau Dashboards Shipped
3 days
Weekly Report Time Saved
Daily
NPS Visibility (was weekly)
Key Takeaways
The biggest win was investing in the unified data model before building a single dashboard. It took an extra two weeks upfront but meant that every new CX question the business asked could be answered in hours rather than days — because all the join logic was already codified in the warehouse layer, not scattered across individual reports.